
In our introductory guide to round numbers, we explored how psychological price levels act like permanent train stations on major forex pairs such as GBP/USD. Today, we are taking a major step forward: applying this objective framework to the most volatile, trending instrument in the retail market: Gold (XAU/USD).
Gold is notorious for erratic price spikes and sudden momentum. If you trade Gold subjectively using discretionary trendlines, the market will frequently punish you. However, when you approach Gold with a strictly mechanical, rule-based grid, its high volatility transforms from an enemy into your greatest advantage.
Here is the exact framework I used to trade XAU/USD systematically on the 15-minute (M15) timeframe.
The Setup: Pair, Timeframe, and Two Simple Lines
- Pair: XAU/USD (Gold Spot)
- Timeframe: M15 (15-Minute Chart)
- Indicators: None. We only plot two horizontal reference levels: Line X and Line Y.
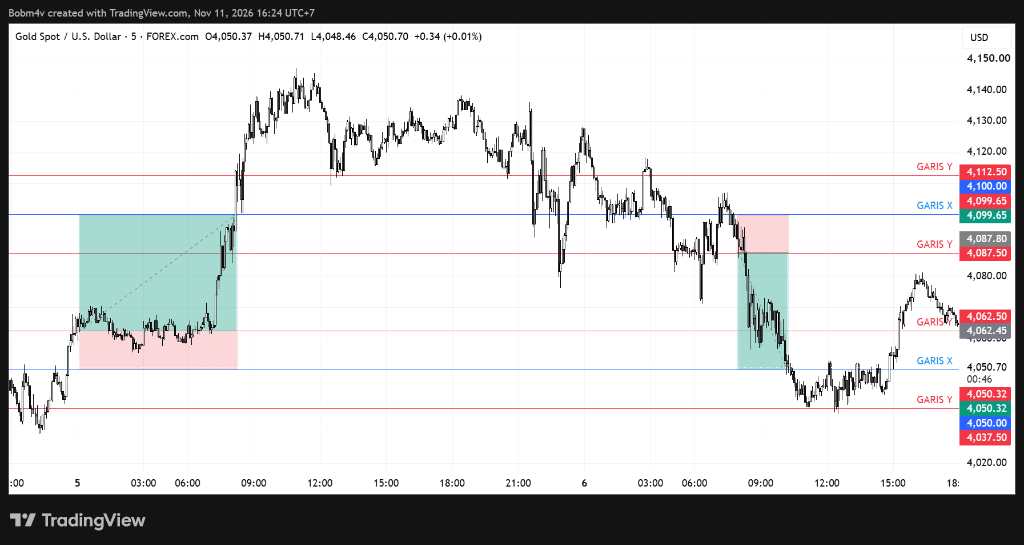
1. Defining Line X (The Base Station)
Line X represents our anchor round number: the primary support and resistance level.
In my strategy, Line X is plotted every 50.00 points (often counted as 5,000 pips depending on your broker’s decimal pricing). Examples include 4,000.00, 4,050.00, 4,100.00, and 4,150.00, extending endlessly above and below current market price.
Traders often ask: “Why 50 points? Why not 15 or 20 points?” The answer always comes back to empirical backtesting. Through extensive historical testing on XAU/USD M15, a 50-point grid provided sufficient breathing room for Gold’s natural intraday noise while capturing explosive expansion runs. You can certainly test 20 or 30 points, but always verify it through historical data before risking capital.
Line X serves three distinct purposes:
- It acts as the trigger checkpoint to place pending orders.
- It serves as our Stop Loss (SL).
- It serves as our Take Profit (TP) target.
2. Defining Line Y (The Entry Trigger)
Line Y is our actual execution boundary, positioned at a fixed distance from Line X. In this strategy, the distance is set to 12.50 points (1,250 pips).
For every Line X, we have two Line Y levels:
- Upper Line Y = Line X + 12.50 (Placement for Buy Stop)
- Lower Line Y = Line X – 12.50 (Placement for Sell Stop)
For example, if Line X sits at 4,100.00, Upper Line Y sits at 4,112.50 and Lower Line Y sits at 4,087.50.
The Execution Rules: Stop Orders Only
The core philosophy of this strategy is trend continuation, not picking tops and bottoms. We never enter with market orders; we let price action pull us into the market using Pending Stop Orders.
- Order Placement: Whenever price touches or crosses Line X (e.g., 4,100.00), we immediately place two pending orders: Buy Stop at Upper Line Y (4,112.50) and Sell Stop at Lower Line Y (4,087.50).
- One-Cancels-the-Other (OCO): As soon as one pending order is triggered, delete the opposite pending order. If price surges upward and triggers our Buy Stop at 4,112.50, immediately cancel the Sell Stop at 4,087.50.
A Concrete Simulation: Walking Through the Numbers
Let’s walk through an exact, step-by-step price simulation around Line X at 4,100.00:
                 [Next Line X: 4,150.00] ---------> TAKE PROFIT (+37.50 pts)
                            ?
                            ?
               [Upper Line Y: 4,112.50] ----------> BUY STOP ENTRY
                            ?
                            ? 12.50 pts (SL)
                            ?
    ???????????????????????????????????????????????
               [Current Line X: 4,100.00] --------> STOP LOSS & RE-TRIGGER LEVEL
    ???????????????????????????????????????????????
                            ? 12.50 pts (SL)
                            ?
               [Lower Line Y: 4,087.50] ----------> SELL STOP ENTRY
                            ?
                            ?
                 [Next Line X: 4,050.00] ---------> TAKE PROFIT (+37.50 pts)
Scenario A: The False Breakout (Hit Stop Loss)
- Price rallies from 4,100.00 and breaks above 4,112.50, triggering our Buy Stop.
- We immediately delete the pending Sell Stop at 4,087.50.
- Our Stop Loss is positioned back at Line X (4,100.00), representing a risk of 12.50 points.
- Instead of continuing upward, momentum stalls and price retreats back down to 4,100.00.
- Our trade is closed at SL for a loss of -12.50 points (or -$12.50 on a 0.01 micro-lot).
- The Next Rule: Because price is now sitting back at Line X (4,100.00), we immediately reset and place the two pending orders again: Buy Stop at 4,112.50 and Sell Stop at 4,087.50.
Scenario B: The Genuine Trend (Hit Take Profit)
- Once again, price surges and triggers the Buy Stop at 4,112.50. We cancel the opposite Sell Stop.
- This time, buyers dominate. Price storms through intraday resistance and reaches the next Line X station at 4,150.00.
- Our Take Profit is hit at 4,150.00, securing a gain of +37.50 points (4,150.00 – 4,112.50).
- On a 0.01 micro-lot, that is a clean +$37.50 profit.
- The Next Rule: Price has now arrived at a new Line X (4,150.00)! We repeat the process for this new station:
- Buy Stop at 4,150.00 + 12.50 = 4,162.50 (SL: 4,150.00 | TP: 4,200.00)
- Sell Stop at 4,150.00 – 12.50 = 4,137.50 (SL: 4,150.00 | TP: 4,100.00)
This cycle continues mechanically, removing emotional hesitation from every single candle.
Why a 1:3 Risk-to-Reward Ratio Changes Everything
At first glance, examining a choppy Gold chart might make you feel uneasy. During consolidation, you will encounter multiple consecutive stop-outs.
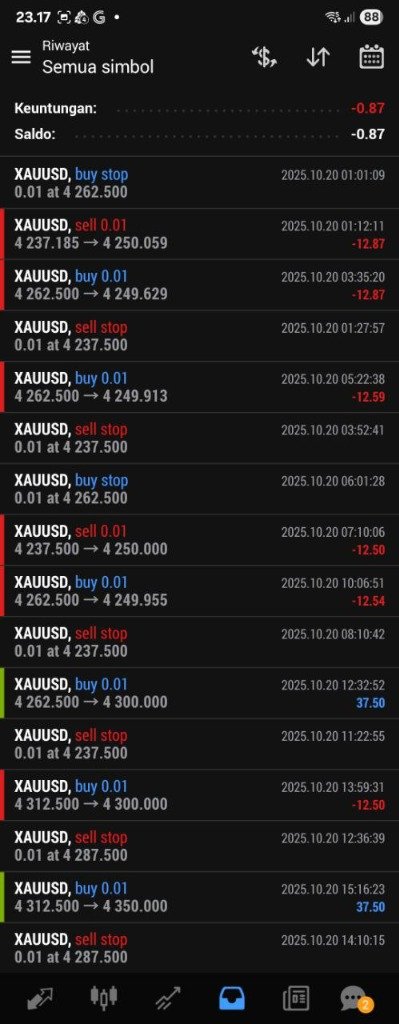
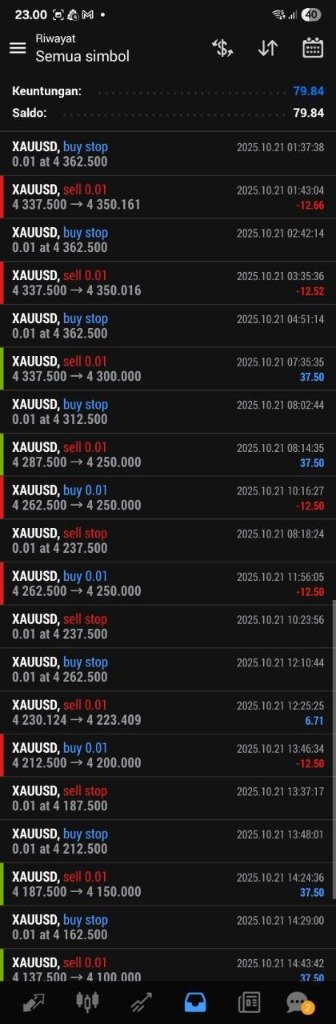
Why am I completely confident running this system despite seeing regular red marks on my terminal? The mathematics of an asymmetric 1:3 Risk-to-Reward ratio.
- Every Loss: -12.50 points (-$12.50 on 0.01 lot)
- Every Win: +37.50 points (+$37.50 on 0.01 lot)
- Ratio: 37.50 / 12.50 = 1:3
Because our reward is three times our risk, one single winning trade completely erases three consecutive losses. You do not need a 70% or 80% win rate to be profitable. With a 1:3 asymmetric payoff, even a modest 35% win rate yields consistent capital growth over a statistically significant sample size.
A Note on Lot Size and Systematic Discipline
In the live execution screenshots above, you will notice I traded micro-lots (0.01). I share this transparently because there is zero reason to hide reality: at the time, this was tested with conservative risk capital.
In algorithmic and systematic trading, your position size is irrelevant; your mathematical expectancy is everything. Whether you trade 0.01 lots risking $12.50 to make $37.50, or 1.00 lot risking $1,250 to make $3,750, the underlying percentage return and statistical edge remain identical. Always master your system on micro-risk before scaling capital.
Summary & What’s Next
Trading Gold does not require predicting the future or interpreting conflicting indicators. By anchoring your trades around predetermined 50-point stations and demanding a 1:3 asymmetric payoff, you let the market do the heavy lifting while keeping risk strictly defined.
In our next post, we will explore how this mechanical framework can be translated directly into an automated Expert Advisor (MQL4), allowing an algorithm to calculate Line X and Line Y coordinates without missing a beat.
Do you trade Gold using breakout orders or pullbacks? What intervals have you tested on your charts? Share your thoughts and questions in the comments below!
?? Note on Timeframe Selection (M15): Because the Round Number Strategy operates on absolute psychological price levels (Line X and Line Y), the price structure itself does not change regardless of the timeframe. However, executing on the 15-Minute (M15) timeframe provides a critical practical advantage: it filters out random intraday noise and false micro-wicks that frequently occur on M5, ensuring cleaner candlestick reactions and more disciplined order execution.
Official Automated Expert Advisor . 100% Free
Automate This Strategy with the Round Number Gold EA
Why calculate Round Number levels and manage pending orders manually? Download the official MT4 Expert Advisor with embedded 1:3 RR math, automatic pending order purge, and the exact backtested preset (+339% gain on Exness-Real33).
Leave a Reply