Tag: backtesting

  • How to Stop Overtrading: Defeating Action Bias in Forex

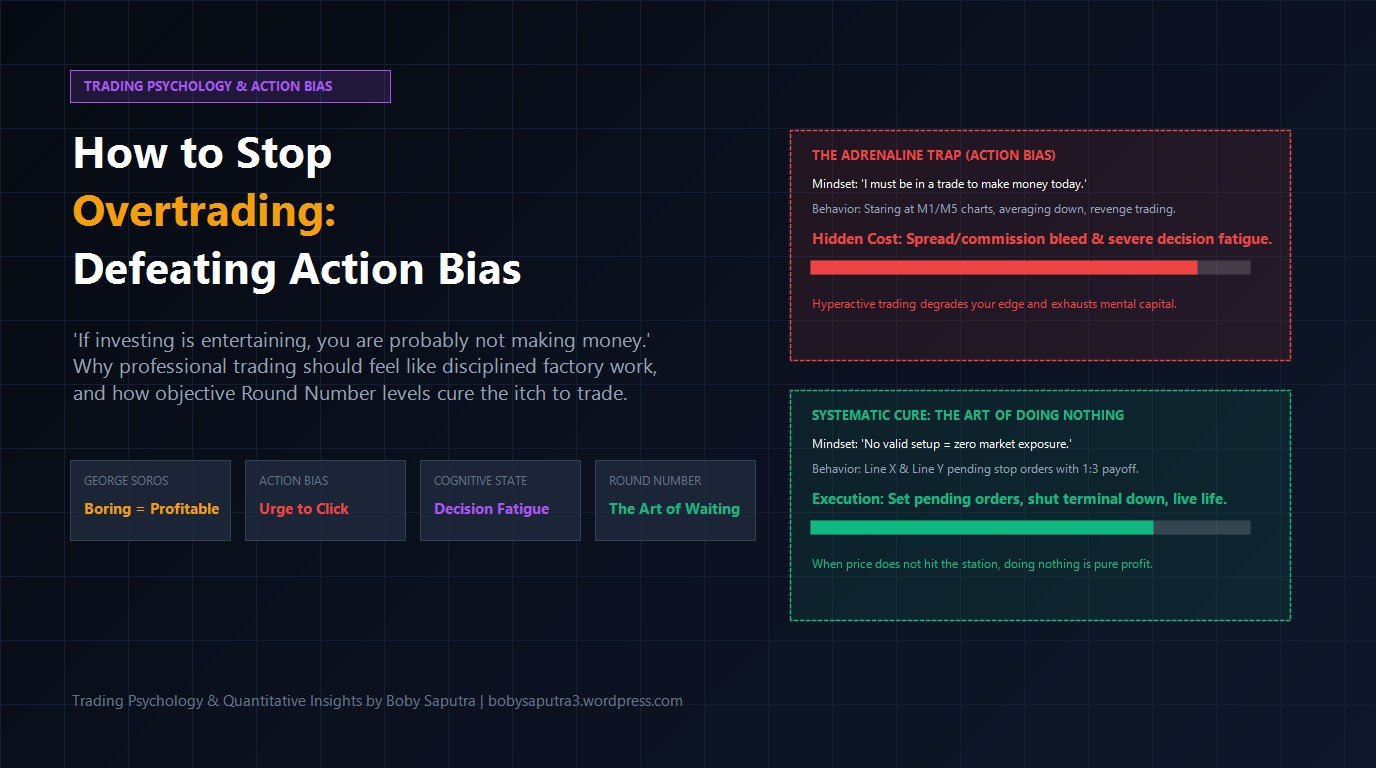
    How to Stop Overtrading: Defeating Action Bias in Forex

    There is a classic quote from legendary investor George Soros that has remained permanently etched in my mind, representing one of the most sobering truths in the financial world:

    “If investing is entertaining, if you’re having fun, you’re probably not making any money. Good investing is boring.”

    George Soros

    To beginner forex traders, this statement sounds completely backwards. Popular media and trading culture portray traders as hyperactive market wizards: sitting in dark rooms surrounded by flashing multi-monitor arrays, rapidly clicking buy and sell buttons, riding intense adrenaline rushes as candlestick charts swing up and down.

    I must admit with complete honesty that during the earlier years of my trading journey, I fell directly into that exact same trap.

    I loved the adrenaline rush. I spent countless hours glued to my computer screen staring at 1-minute and 5-minute charts late into the night. I cycled through aggressive strategies: grid systems, averaging down into losing positions, and even martingale variants. Whenever a trade went into a floating loss, I quickly opened another position higher or lower, desperately trying to manipulate the market into giving me an exit.

    At the time, I felt like a dedicated professional working intensely for my future. The painful reality was far different: I was not running a disciplined business; I was simply addicted to dopamine and adrenaline.

    In this article, we will examine the cognitive trap known as Action Bias, uncover the hidden costs of overtrading, and explore how our Gold M15 Round Number strategy trains you to embrace boredom as your ultimate competitive advantage.

    1. Understanding Action Bias: The “Itchy Finger” Syndrome

    In behavioral economics, psychologists identify a powerful phenomenon called Action Bias. It is the natural human urge to take action, especially in the face of uncertainty, even when doing absolutely nothing is objectively the superior choice.

    In everyday life, action bias is generally rewarded. If a pipe bursts in your home or an urgent problem surfaces at work, taking immediate action is praised as proactive and responsible. Sitting quietly and waiting is often labeled as lazy or indecisive.

    One famous study examining action bias looked at professional football goalkeepers during penalty kicks. Statistical analysis revealed that a significant percentage of penalty shots are struck straight down the center of the goal. If a goalkeeper simply remains standing in the center, their probability of saving the shot increases dramatically.

    Yet, in real matches, more than 90% of goalkeepers dive to the left or right. Why? Because diving and conceding a goal feels socially and psychologically acceptable. You look like you tried. Standing perfectly still in the center while the ball sails into the net feels humiliating, even if staying centered offered the best mathematical odds.

    When this identical human instinct enters financial markets, it leads to severe overtrading:

    • Traders feel that if they haven’t opened a trade by midday, their day has been wasted and they “haven’t worked.”
    • When price moves sharply on an M15 candle, fear of missing out (FOMO) kicks in, prompting an impulsive click without a verified technical setup.
    • Once inside an active trade, the trader feels an irresistible urge to fiddle with the position: dragging Stop Losses, moving Take Profits, or closing winners prematurely just to feel in control.

    2. The Hidden Costs of the Adrenaline Addiction

    The financial market does not care how intensely you stare at your screen. Indulging action bias incurs three heavy penalties that consistently erode retail trading accounts:

    A. Friction Bleed: Spreads and Commissions

    Every single transaction incurs an immediate, non-negotiable cost: the broker’s spread and commission markup. If you open 15 to 25 trades a day searching for market action, you are paying a massive friction tax directly to your broker before price even has a chance to move in your favor. Over a month, this friction alone can wipe out an entire account balance.

    B. Decision Fatigue and Emotional Collapse

    The human brain has a finite reserve of willpower and rational decision-making energy each day. If you force your brain to evaluate dozens of micro-fluctuations every few minutes, you rapidly trigger decision fatigue.

    When cognitive exhaustion sets in, emotional self-control disintegrates. This is the precise moment when disciplined traders turn reckless: breaking the 1% risk rule, revenge trading after a routine loss, or loading excessive lot sizes to “win back” paper losses.

    C. Diluting Your Statistical Edge

    A systematic trading strategy generates long-term profits because it possesses an objective statistical edge across hundreds of historical samples. However, that edge functions only when executed on valid, pre-defined parameters.

    When you place random discretionary trades out of boredom or FOMO, you inject random noise into your trading distribution. You transform a proven mathematical expectancy into a negative-sum lottery.

    3. Professional Trading Should Feel Like Factory Work

    If you observe institutional quantitative managers who have operated in financial markets for decades, their daily work is remarkably calm and routine.

    Mature systematic trading resembles the work of a quality control operator or a precision technician:

    1. Check if pre-defined market criteria are fulfilled.
    2. Place calculated orders with fixed risk parameters.
    3. Step away from the screen and let mathematical probability do its job.

    There is no screaming, no fist-pumping, and no nail-biting anxiety. Consider the analogy of an elite military sniper: the vast majority of their time is spent lying completely still in camouflage, monitoring conditions, and waiting for the target to enter the crosshairs. They do not fire wild rounds into the brush because they feel bored waiting. One calculated shot is infinitely more effective than fifty undisciplined shots.

    4. How the Round Number Strategy Enforces the Art of Doing Nothing

    When I established the mechanics for our Round Number strategy on Gold (XAU/USD M15) and GBP/USD, one of my highest priorities was removing action bias entirely from the equation.

    Recall how the system is constructed:

    • Line X: The objective, psychological whole number that acts as our benchmark station (for instance, the 4,100.00 level on Gold or 1.2900 on GBP/USD).
    • Line Y: The exact offset level where our pending stop orders are staged, accompanied by a fixed Stop Loss (strictly 1% of equity) and an asymmetric 1:3 Take Profit target.

    Once those levels are calculated and pending orders are placed, our active involvement as a trader is 100% finished.

    You do not need to watch candlesticks print every 5 minutes. If price consolidates tightly between levels for an entire trading session without touching Line Y, no trades are triggered. Not a single dollar of your capital is risked.

    Years ago, an uneventful day like that would have made me restless, tempting me to take random trades in the middle of nowhere. Today, I view it through the lens of quantitative discipline: when the market offers no valid setup, doing nothing is the single most profitable decision you can make.

    Action Bias vs. Systematic Discipline: A Direct Comparison

    Trading AspectThe Overtrader (Action Bias)The Systematic Trader (Round Number)
    Core MotivationSeeking market thrills, dopamine, and feeling “busy.”Extracting mathematical expectancy over hundreds of setups.
    Screen Time6 to 12 hours glued to fluctuating M1/M15 Charts daily.15 minutes to set pending orders, then terminal is shut down.
    Response to InactivityFrustration, FOMO, forcing entries into choppy consolidation.Calm acceptance: no setup at Line Y equals zero risk exposure.
    Transaction OverheadMassive spread and commission drag from excessive trades.Minimal friction: only high-conviction breakout levels triggered.
    Long-Term OutcomeBurnout, decision fatigue, and inevitable capital wipeout.Mental longevity, controlled 1% drawdowns, sustainable growth.

    Conclusion: Are You Trading for Entertainment or for Income?

    Every trader eventually arrives at a fork in the road where they must answer one fundamental question with unsparing honesty:

    Are you trading forex to experience entertainment and thrill, or to build long-term capital?

    If your underlying goal is to experience an adrenaline rush, heart-thumping suspense, or emotional drama, please realize that roller coasters, horror movies, or extreme sports are vastly cheaper than funding an adrenaline addiction with your trading balance.

    If your goal is to survive and compound capital across years in the market:

    • Learn to welcome the boredom of systematic routines.
    • Recognize action bias for what it is: an evolutionary instinct that sabotages trading accounts.
    • Define your levels objectively, stage your pending stop orders with pre-set 1% risk and 1:3 targets, and close your charts.

    The market will be here tomorrow. Your capital, if not guarded against itchy fingers, may not.


    Want to discuss or share your thoughts?
    Have you ever fallen into the trap of staring at charts for hours and forcing trades out of boredom? What specific rule or routine helped you break free from action bias? Share your experience in the comments below, I read and reply to every comment!
  • Why Forex Brokers Profit in Strong Trends: The Retail Trap

    Why Forex Brokers Profit in Strong Trends: The Retail Trap

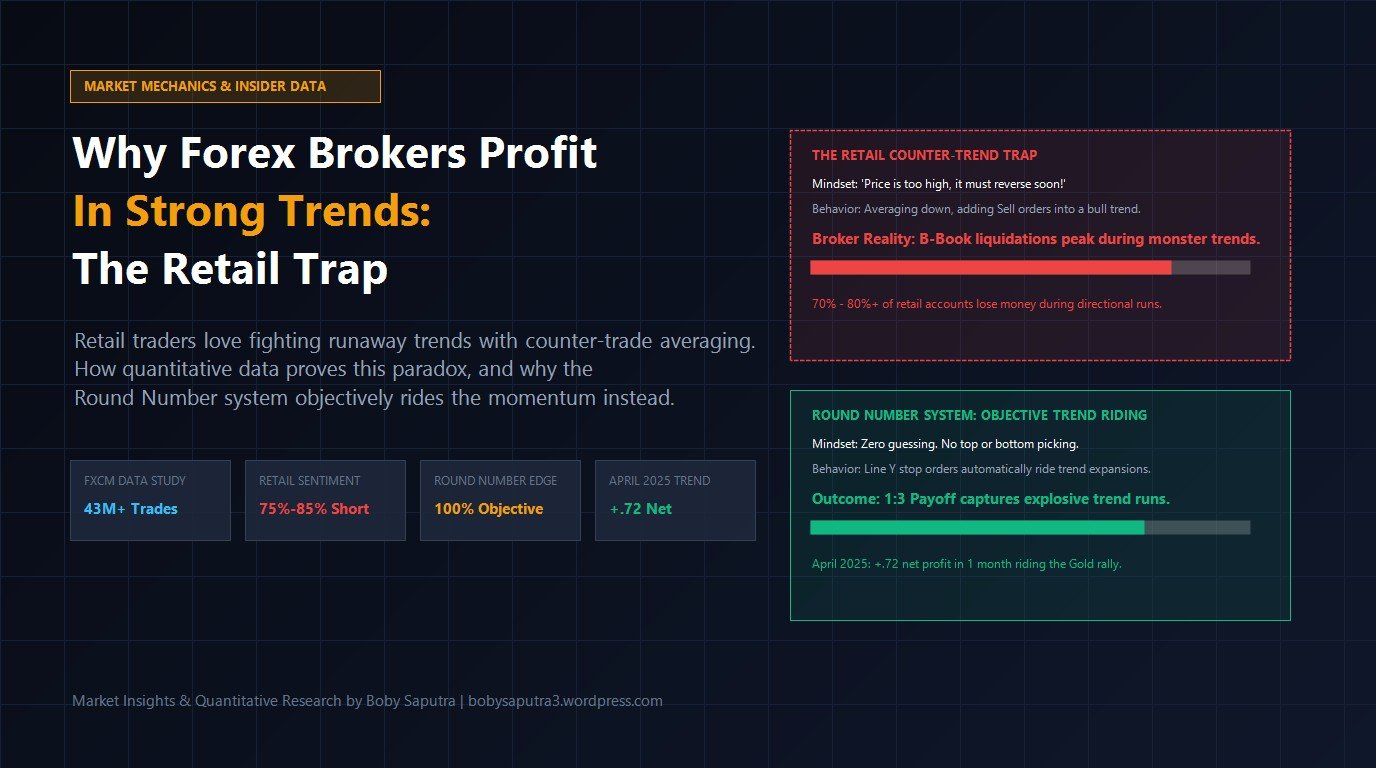
    To beginner traders, an insider reality of the forex industry sounds completely counter-intuitive: brokers make the vast majority of their profits when markets are strongly trending. Doesn’t conventional trading wisdom always preach the classic adage: “The trend is your friend”? If a market is roaring in a clear directional trend, shouldn’t capturing profits be far easier than navigating choppy consolidation?

    Years ago, a respected mentor who spent over a decade working inside the institutional brokerage industry revealed this counter-intuitive truth to me. When markets enter tight, range-bound consolidation, retail traders often feel comfortable. They scalp quick wins, pick small turning points, and book modest profits. But when a powerful, sustained macro trend takes off, particularly in volatile commodities like Gold (XAU/USD), brokerage dealing desks see record revenue. Why? Because retail traders persistently attempt to fight the trend.

    In this article, we will examine the hard empirical data behind this industry phenomenon, explore the cognitive traps that lead traders into financial ruin during trending moves, and contrast this with how our Gold M15 Round Number strategy eliminates predictive bias to capture trend expansions mechanically.

    1. The Empirical Data: The Retail Counter-Trend Obsession

    Is the mentor’s observation just anecdotal folklore, or is it backed by empirical market data? Let us look at what independent research and regulatory disclosures demonstrate.

    The FXCM 43-Million Trade Study

    One of the most comprehensive statistical studies ever conducted on retail forex trading was DailyFX’s famous benchmark study, Traits of Successful Traders, which analyzed over 43 million real-money trades executed through the FXCM brokerage network.

    The researchers uncovered an astonishing paradox:

    • In most major currency pairs, retail traders actually won over 50% to 60% of their individual trades.
    • Yet, despite winning the majority of their trades, the vast majority of these accounts suffered heavy net losses.

    Why did this happen? Because retail traders demonstrated a chronic asymmetry between gains and losses. During calm sideways markets, traders booked frequent small gains of 10 to 15 pips. But when the market broke into a trending run, they refused to accept small stop losses. Instead, they held losing trades, hoping for a pullback, ultimately losing 50, 100, or 200 pips on single runaway moves.

    Retail Sentiment Disclosures: The Gold Shorting Trap

    We see this phenomenon play out repeatedly in real time on retail sentiment feeds, such as the IG Client Sentiment Index or broker position heatmaps. Whenever Gold embarks on an aggressive historic bull run, climbing through major round numbers like 2,400, 2,500, or 2,600, retail sentiment consistently skews heavily net-short, frequently showing 75% to 85% of retail open volume fighting the uptrend.

    Why do thousands of retail traders short a roaring bull market? Because humans are psychologically anchored to previous prices. Traders tell themselves: “Gold has risen too far, too fast. It is heavily overbought. It has to retrace.”

    They sell at resistance, get stopped out or add margin, sell again higher, and get caught in a vicious short squeeze until their margin is completely exhausted.

    2. The Broker Business Model: Why B-Book Desks Flourish in Trends

    To understand why brokers make so much money during trends, one must understand how retail forex brokerage architecture actually works.

    Retail brokers generally operate through two primary models (or a hybrid combination of both):

    • A-Book (STP / ECN): The broker routes all client orders directly to external liquidity providers (tier-1 banks, institutional prime brokers). The broker earns revenue strictly from commissions and spread markups. They carry zero market risk regarding whether the client wins or loses.
    • B-Book (Market Making / Dealing Desk): The broker acts as the direct counterparty to client trades. When a client buys, the broker sells to them internally; when a client sells, the broker buys from them. The broker takes on market risk, meaning client trading losses become direct revenue for the brokerage firm.

    Regulatory transparency reports from authorities like ESMA (European Securities and Markets Authority), the UK FCA, and the Australian ASIC mandate that brokers publish the percentage of retail accounts that lose money. Quarter after quarter, these numbers hover reliably between 70% and 82%.

    Knowing these statistical probabilities, many retail brokers internalize high percentages of retail order flow. In calm, oscillating markets, dealing desks face balanced flow and lower volatility. But when a massive, one-way trending move begins, retail traders enter an aggressive counter-trend spiral: averaging down, removing stop losses, and getting liquidated in waves. For a B-Book desk holding the other side of these retail positions, strong trends produce windfall quarters.

    3. The Psychology Behind the Trap: Why Traders Fight Strong Trends

    Why is counter-trend behavior so deeply ingrained in retail trading psychology? It stems from fundamental human cognitive biases that serve us well in everyday life, but prove fatal in financial markets:

    1. The “Cheapness” Illusion & Anchoring Bias: When people shop for consumer goods, buying items at a discount makes rational sense. But in financial markets, an asset that has doubled in price is not necessarily “expensive”, it is showing massive institutional demand. Retail traders anchor to old price levels and perceive new highs as artificially expensive.
    2. The Gambler’s Fallacy: After 5 consecutive green daily candles, the human brain instinctively expects a red candle, assuming price “has to balance out.” In reality, trending markets are autocorrelation mechanisms: strong momentum tends to persist far longer than anyone expects.
    3. Fear of Buying at the Very Top: Retail traders hesitate to buy breakout moves because they dread the humiliation of buying the exact peak. Irony strikes when their fear of buying tops leads them directly into trying to pick tops by shorting, which carries exponentially higher risk.
    4. Averaging Down (Martingale Mentality): When a short position moves into a floating loss, traders convince themselves that adding another short higher up will lower their average entry price, allowing them to escape on the first tiny dip. When the dip never arrives, the entire account is wiped out in a single afternoon.

    4. Retail Mindset vs. Objective Round Number Execution

    Let us look at how typical retail behavior compares directly against our mechanical Round Number strategy during different market regimes:

    RegimeTypical Retail ApproachRound Number Strategy (Gold M15)
    Sideways / Choppy MarketScalps small gains, feels confident, books 60-70% win rate.Takes small 1% stop losses (-$12.50). Treats chop as an operational expense.
    Breakout Out of RangeFades the move, expecting a false breakout and mean reversion.Pending stop orders on Line Y trigger in the direction of the breakout.
    Strong Directional TrendAverages down into losing positions, widens stops, gets liquidated.Captures sequential +$37.50 take profits (1:3 payoff) riding the wave.
    Overall Mathematical OutcomeHigh win rate, catastrophic negative expectancy (Account Blowup).Low win rate (30.5%), high asymmetric positive expectancy (+302%).

    5. Real Backtest Proof: How Trends Generate Exponential Returns

    In our earlier article on Surviving the Chop, we examined the difficult periods of the strategy, specifically August 2024, where a sideways summer market triggered a painful 13-loss streak (-$165.72).

    Now, let us examine the other side of the coin: what happens when the market actually trends?

    In our 18-month quantitative backtest on XAU/USD (Gold M15) using 0.01 micro-lots from a modest $300 starting capital:

    • April 2025: Gold experienced a massive directional expansion. Because our strategy places pending stop orders around Line X key levels, the system repeatedly triggered breakout trades along the path of least resistance.
    • In that single 30-day period, the strategy delivered +$366.72 in net profit across 42 trades with a 47.6% win rate.
    • That single month of trending price action generated a +122% return on the initial capital base, completely wiping out months of previous sideways attrition.
    • Over the full 18-month duration, the system grew the account from $300 to $1,208 (+302% net gain), despite enduring a modest 30.47% overall win rate.

    While counter-trend traders were fighting the trend and transferring their balances directly to B-Book broker ledgers, an objective breakout strategy simply rode the wave with fixed, asymmetric risk parameters.

    6. The 3 Pillars of Riding Trends Without Guessing Tops

    How can you ensure you stay on the right side of market trends without falling into the predictive trap?

    Pillar 1: Total Objectivity (No Opinions on Price Level)

    Never say to yourself, “Gold cannot go any higher” or “This pair has fallen too far.” Price can go anywhere institutional liquidity dictates. By using round numbers (such as 100-pip benchmarks on GBP/USD or 10-point levels on Gold) as Line X, you establish an objective benchmark that has zero emotional bias.

    Pillar 2: The Asymmetric 1:3 Payoff Structure

    Never accept small gains while tolerating large drawdowns. As detailed in our guide on Forex Risk Management and the 1% Rule, fixing your risk to 1% (-$12.50) while demanding 3% (+$37.50) on winning moves guarantees that a single trend-riding winner pays for three losing attempts.

    Pillar 3: Automated Order Discipline (OCO Mechanics)

    When you trade manually, discretionary hesitation causes you to miss entries or close winners prematurely. By automating your strategy through an Expert Advisor (EA) with One-Cancels-the-Other (OCO) logic, once price triggers the trend-side Line Y pending stop order, the opposite counter-order is immediately deleted. You let the market either tag your 1:3 target or exit cleanly at your pre-defined stop loss.

    Conclusion: Aligning with the Reality of Markets

    The forex market is an arena of unforgiving probabilities. Retail brokers generate enormous profits during powerful trends because the untrained human mind naturally seeks to fade extremes, pick reversals, and average down into losing positions.

    To transition from the losing 75% retail statistic into the disciplined minority, you must invert this behavior:

    • Accept that sideways markets will cost you small, controlled 1% stop losses.
    • Stop predicting where the market “should” stop.
    • Use objective pending stop orders to participate when price breaks out into aggressive directional trends.
    • Let an asymmetric 1:3 reward ratio do the heavy lifting over hundreds of trades.

    When you align your execution with the true mechanics of market momentum, you stop feeding the broker’s dealing desk and start capturing the trend expansions that make systematic trading worthwhile.


    Want to discuss or share your thoughts?
    Have you ever fallen into the trap of shorting a roaring uptrend or averaging down into a runaway move? What rule helped you break that habit? Let us know in the comments below, I read and respond to every insight!

  • Forex Risk Management: Why the 1% Rule Protects Your Account and Mental Health During Losing Streaks

    Forex Risk Management: Why the 1% Rule Protects Your Account and Mental Health During Losing Streaks

    In my previous article, we explored how the Round Number strategy on Gold (XAU/USD M15) behaves during choppy, sideways market conditions. We looked closely at real trade logs and dissected an 18-month backtest.

    From that backtest report, one specific metric caught many traders by surprise: a streak of 13 consecutive Stop Losses (occurring in August 2024, resulting in a cumulative drawdown of -$165.72).

    Seeing that an initial $300 test account eventually grew to $1,208 (+302% net return) across 18 months looks exciting on a chart. But let me be completely candid: I am not writing this article to sell a get-rich-quick illusion of turning small pocket change into a fortune overnight.

    In real-life trading with hard-earned savings, watching a $300 balance drop by more than 50% in a few weeks will destroy almost anyone’s mental health. Your heart rate spikes, stress takes over, you lose sleep at night, and you eventually succumb to revenge trading-doubling your lot size until your account blows up completely.

    Long-term survival in trading is not about finding an impossible, zero-loss system. True longevity comes from combining adequate capital, the 1-2% risk rule, and a calm, protected mental state.

    1. The Statistical Reality: Losing Streaks Are an Absolute Certainty

    Let us examine the numbers without emotion or wishful thinking. In our Gold M15 Round Number strategy, we trade with a fixed 1:3 asymmetric Risk-to-Reward ratio:

    • Each Stop Loss (SL) costs -$12.50 (12.5 points on a 0.01 lot).
    • Each Take Profit (TP) yields +$37.50 (37.5 points on a 0.01 lot).

    Across our 384 closed backtest trades:

    • Total Wins: 117 trades (Win Rate = 30.47%, rounded to ~30.5%)
    • Total Losses: 267 trades (Loss Rate = 69.53%, rounded to ~69.5%)

    Now, what is the probability of suffering 13 consecutive losses in a single, isolated run? Mathematically, it is 0.695 multiplied by itself 13 times, which equals approximately 0.0087 (or 0.87%).

    At first glance, 0.87% looks tiny-well under 1%. Most retail traders glance at that number and assume, “That’s less than a one percent chance. It will never happen to me.”

    However, trading is not a single coin toss. We trade continuously across hundreds of setups. In an ongoing series of 384 trades, the probability of experiencing at least one streak of 13 consecutive losses is calculated as:

    P(Streak ≥ 13) = 1 – (1 – 0.695¹³)³⁸⁴ ≈ 1 – 0.0345 ≈ 96.5%

    Look at that figure carefully: 96.5%.

    If you execute this strategy consistently across 384 trades with a 30.5% win rate, hitting a 13-loss streak is virtually guaranteed by the laws of mathematics.

    That rough patch in August 2024 was not bad luck, and it was not a sign of a defective strategy. It was a normal manifestation of random distribution in a probabilistic market. If you are unprepared for it, you will abandon your system at the bottom of the drawdown, right before the profitable expansion phase begins.

    2. The 1-2% Risk Rule: Your Real Defense Fortress

    This is where the fundamental line is drawn between a gambler and a professional quantitative trader. A gambler enters a trade thinking, “I hope this position makes money.” A quant enters a trade asking, “What percentage of my capital disappears if this position is wrong?”

    The golden rule of professional capital preservation is straightforward: never risk more than 1% to 2% of your total account balance on any single trade.

    Let us apply this math to our Gold M15 setup:

    • One Stop Loss on 0.01 lot Gold equals approximately -$12.50.

    How much capital should you actually hold in your account?

    • At 2% Risk Per Trade: $12.50 / 0.02 = $625 Minimum Capital.
    • At 1% Risk Per Trade (Strongly Recommended): $12.50 / 0.01 = $1,250 Ideal Capital.

    Now, imagine the worst-case scenario from our backtest hits your live account: 13 consecutive Stop Losses.

    If you follow the 1% risk rule with a $1,250 account:

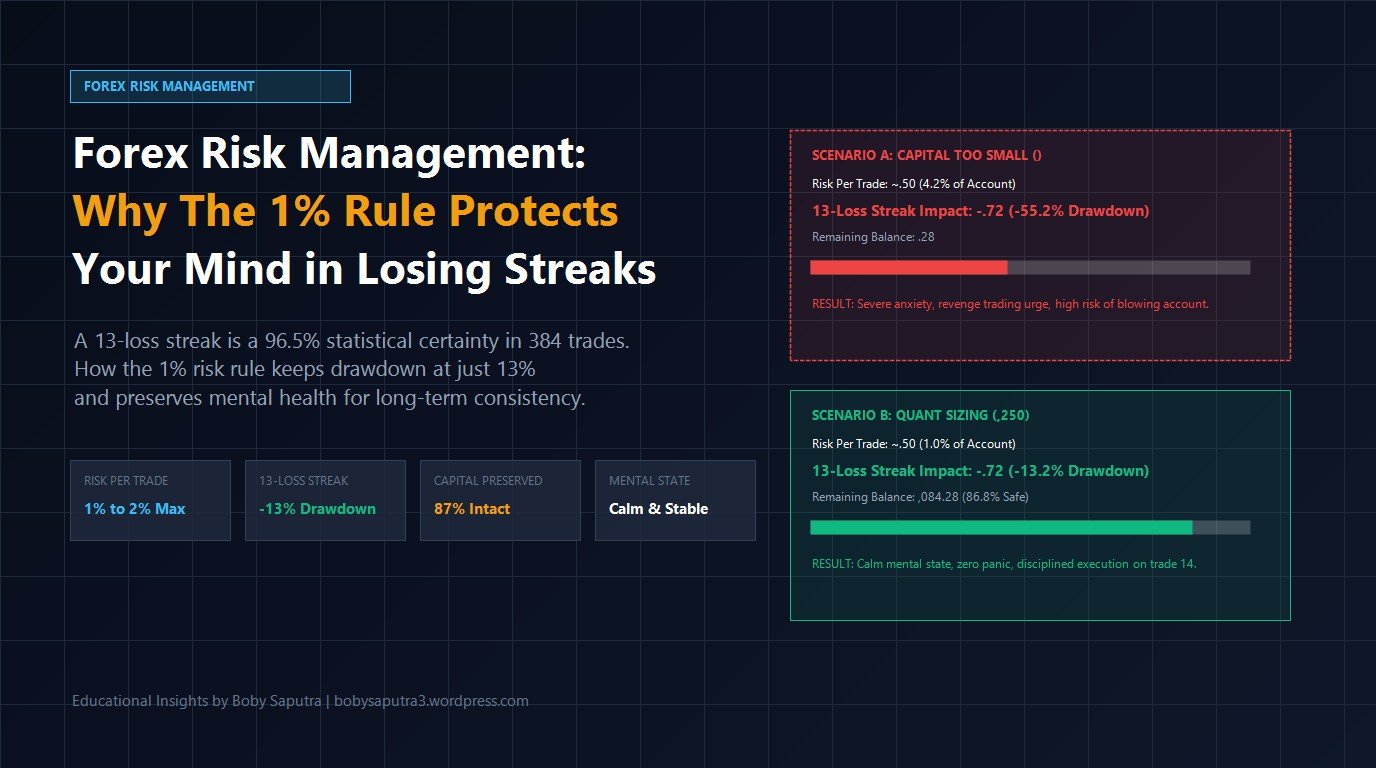
    • Your total drawdown across all 13 losses is just: 13 × 1% = 13% (approximately -$165).
    • Your remaining balance is still 87% intact (around $1,085).
    • Your margin level remains thick and secure. You are nowhere near a Margin Call, and your capital base remains solid.

    3. Protecting Your Mental Health: Why 13% Keeps You Sane

    Trading is not just numbers flickering on a chart; it is a relentless test of human psychology.

    Compare the two mental realities when facing that exact same 13-loss streak:

    Account Metric Scenario A: Under-Capitalized Scenario B: Quant Sizing
    Starting Balance $300.00 $1,250.00
    Risk Per Trade (0.01 Lot) 4.2% per loss 1.0% per loss
    Drawdown (13 Losses) -55.2% (-$165.72) -13.2% (-$165.72)
    Remaining Balance $134.28 (Dangerous) $1,084.28 (Safe & Strong)
    Psychological State Severe anxiety, insomnia, revenge trading urge Calm, confident, disciplined execution

    In Scenario A, losing -$165 wipes out more than half of your capital. Your brain enters fight-or-flight panic mode. Self-doubt creeps in, insomnia strikes, your emotions spiral, and you will almost certainly shut down the robot or attempt reckless revenge trades right before the market shifts into a massive trend.

    In Scenario B, losing -$165 removes just 13% of your capital. You still have $1,085 sitting safely in your account. A 13% drawdown is a normal, healthy fluctuation that your mind can process comfortably. You eat your meals in peace, sleep soundly through the night, and spend quality time with your family without trading anxiety hanging over your head.

    “Discipline is not about forcing yourself to endure excruciating mental agony. Real discipline happens naturally when your risk per trade is so small that a loss cannot disturb your peace of mind.”

    Boby Saputra

    A calm, protected mental state is what allows you to execute trade number 14 with complete discipline and zero hesitation.

    4. The Philosophy of the 0.01 Micro-Lot: Longevity Over Ego

    Many novice traders feel insecure trading a 0.01 micro-lot. They see people on social media flaunting screenshots with 0.50 or 1.00 lot sizes and feel pressured to size up prematurely to get rich quickly.

    Put your ego aside. In quantitative trading, nobody cares how big your lot size is. What matters is how many years you stay alive in the market.

    A 0.01 micro-lot is not a symbol of small thinking; it is an instrument of precision to keep your risk strictly inside that 1% boundary. If your account holds $1,000 to $1,250, your required lot size is 0.01. When your account organically compounds to $2,500, you can step up to 0.02 lot in a measured, disciplined manner.

    Trading is a lifelong marathon, not a 100-meter dash.

    5. The Winning Formula: Strong Capital + Controlled Risk + Calm Mind

    Why did our system achieve a net profit of +$908 (+302%) over 18 months despite having a modest win rate of only 30.5%?

    The answer lies in the 1:3 asymmetric payoff:

    • Each Take Profit (+$37.50) completely neutralizes 3 Stop Losses (-$12.50).
    • Over 384 trades, we absorbed 267 losses, but collected 117 wins.
    • Those 117 wins had the earning power of 351 losses, leaving a net profit surplus of 84 trade units.

    When your capital is strong ($1,000 to $1,250 per 0.01 lot), you give the mathematics of probability ample breathing room to play out. You survive the choppy consolidation storms without panicking. And when Gold begins its extended directional runs, your account reaps the rewards without emotional interference.

    When you align these three pillars:

    1. An adequate capital base,
    2. A strict 1-2% risk limit per trade, and
    3. A healthy, undisturbed mental state,

    Then for a systematic trader, success is no longer a matter of luck-it is simply a matter of time.

    Key Takeaways

    Do not get seduced by the illusion of doubling your money overnight. Focus on fortifying your account’s defense first.

    • Streaks of 10 to 13 consecutive losses are a statistical certainty, not a strategy defect.
    • Follow the 1% risk rule (prepare around $1,000 to $1,250 per 0.01 lot on Gold M15).
    • When a 13-loss streak arrives, you only lose 13% of your capital. Your account stays safe, and more importantly: your mental health remains intact.
    • Let the 1:3 asymmetric payoff do the heavy lifting over hundreds of trades.

    Want to discuss or share your thoughts?
    How do you manage your risk per trade? Have you ever experienced the psychological burnout of a deep drawdown, and how did you overcome it? Feel free to share your thoughts and experiences in the comments below!

  • Surviving the Chop: The Psychology and Math of the Gold Round Number Strategy in Sideways Markets

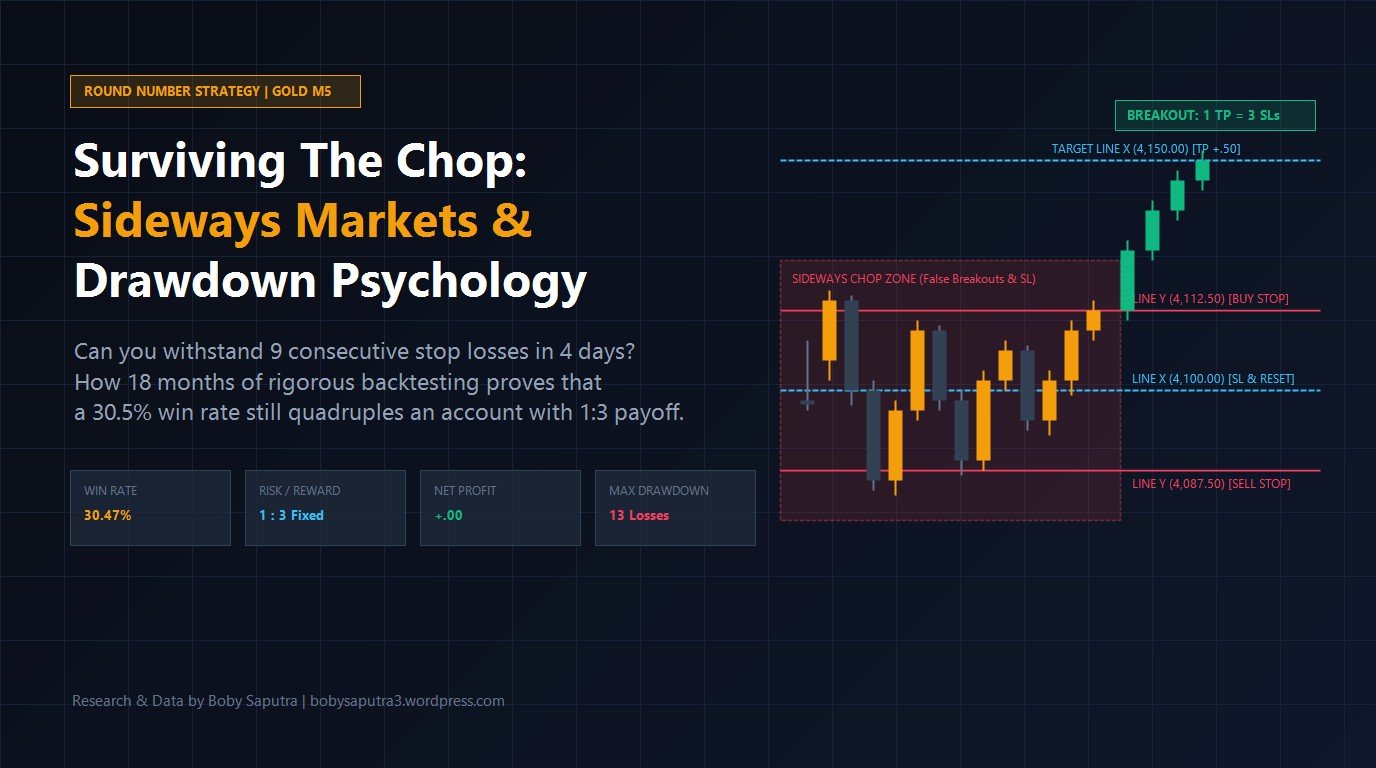
    Surviving the Chop: The Psychology and Math of the Gold Round Number Strategy in Sideways Markets

    In my previous article, I laid out the mechanics of my Round Number strategy on XAU/USD (Gold) using the M15 timeframe. We discussed how Line X acts as our benchmark support and resistance level, while Line Y sets our pending stop orders with an asymmetric 1:3 risk-to-reward ratio.

    Today, I want to address the elephant in the room: sideways and range-bound market conditions.

    Every breakout and trend-following strategy has an inherent vulnerability, and for the Round Number system, it is choppy price action. When the market lacks directional momentum and oscillates tightly across our key levels, pending orders get triggered back and forth, resulting in rapid stop losses.

    Is facing a sideways market really as terrifying as most traders fear? Let us dissect a real-world scenario on Gold to see what actually happens to our account, both mathematically and psychologically.

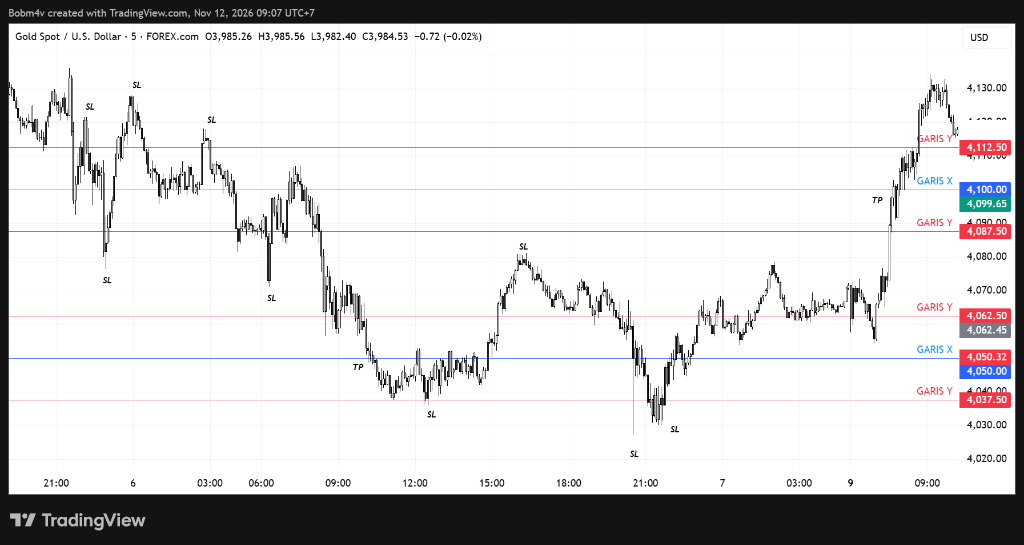
    Dissecting the Sideways Scenario: Gold M15 (November 5–9, 2026)

    Take a look at the TradingView chart below, captured on the M15 timeframe between November 5 and November 9, 2026. This is a classic textbook example of sideways market consolidation around our 4,100.00 Line X.

    XAU/USD M15 Sideways Chop Market (Nov 5-9, 2026)
    XAU/USD M15 Sideways Price Action (Nov 5–9, 2026): 9 Stop Losses and 2 Take Profits around the 4,100 Round Number.

    During these four trading days, price action whipsawed through Line X repeatedly without establishing a sustained directional run. Here is the exact trade sequence that unfolded:

    • 5 Consecutive Stop Losses: Price triggered pending orders and snapped straight back to Line X.
    • 1 Take Profit: A temporary expansion finally reached the next Line X (+37.5 points).
    • 4 Consecutive Stop Losses: Another tight oscillation trapped multiple entries.
    • 1 Take Profit: A second expansion hit target.

    Let us tally the score: 9 Stop Losses and 2 Take Profits over four days.

    If you execute this with a fixed 0.01 lot size (with standard 100-oz contract sizing on Gold), here are the exact dollars and cents:

    • Total Loss (9 SLs @ -$12.50): -$112.50
    • Total Profit (2 TPs @ +$37.50): +$75.00
    • Net Strategy Result: -$37.50

    Notice the numbers carefully. Despite losing 9 out of 11 trades (an 18.2% win rate during this chop), the net loss was only -$37.50. Why? Because those 2 winning trades absorbed 6 of the 9 losses all by themselves.

    The Psychological Battle: Surviving Your Own Mind

    The real danger here is not the -$37.50 drawdown. The true battlefield is inside your head.

    Put yourself in that chair from November 5 to November 9. You sit in front of your screen for four straight days. You take five losses in a row. You get one small relief with a win, only to be slammed with four more consecutive losses. By the end of the week, your account is in the red.

    What thoughts cross your mind when this happens?

    • “Is this strategy completely broken?”
    • “Maybe I should double my lot size on the next trade to win it all back.”
    • “Should I widen my stop loss so it doesn’t get hit so easily?”
    • “Maybe I should adjust Line Y from 1,250 pips to 2,000 pips right now.”

    This is where 95% of retail traders fail. They fall prey to revenge trading. They tweak rules during a drawdown. They abandon a mathematically sound strategy right before the explosive trend arrives.

    “I already know the mathematical probability of this strategy. I do not expect to make a profit every single day. That is why I stay disciplined and stick strictly to the rules.”

    Boby Saputra

    Discipline is not tested when you are riding an effortless winning streak. Discipline is tested when you have to enter the 10th trade after suffering 9 consecutive stop losses, trusting the mathematics of your edge completely.

    From Live Assumptions to 18 Months of Robot Backtesting

    To be completely transparent, I originally traded this Round Number strategy manually in the live market for about three months. Experienced traders will tell you that three months is too short a window to prove that a strategy can survive across all market regimes. And they are completely right.

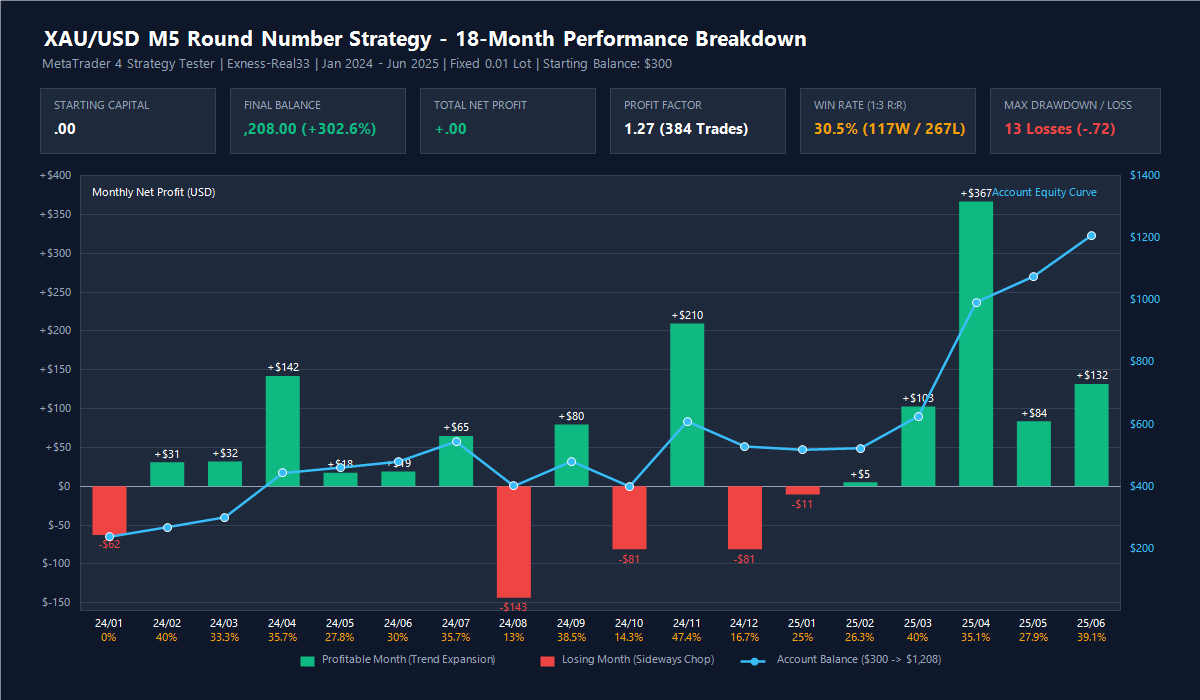
    While my live experience matched my expectations, I knew assumptions were not enough. I needed cold, hard, quantitative verification. So I coded this strategy into an automated MetaTrader 4 Expert Advisor (robot) and ran a tick-by-tick backtest over 18 months on Exness-Real33 data, covering January 1, 2024 through June 18, 2025.

    Here is the high-level summary from the MetaTrader 4 Strategy Tester report:

    • Initial Deposit: $300.00
    • Final Balance: $1,208.00 (+302.6% Net Gain)
    • Total Net Profit: +$908.00
    • Total Closed Trades: 384 trades
    • Overall Win Rate: 30.47% (117 Wins / 267 Losses)
    • Average Profit Trade: +$36.70 (37.5 points)
    • Average Loss Trade: -$12.68 (12.5 points)
    • Profit Factor: 1.27
    • Max Consecutive Loss Streak: 13 consecutive losses (-$165.72)
    • Max Consecutive Win Streak: 7 consecutive wins (+$261.58)

    Monthly Breakdown: Analyzing the Profit and Loss Rhythm

    To see how the robot weathered choppy market phases over time, here is the complete month-by-month performance breakdown:

    XAU/USD M15 Round Number Strategy 18-Month Performance Breakdown
    18-Month Performance Breakdown (Jan 2024 – Jun 2025): Monthly Net Profits and Account Equity Curve Growth from $300 to $1,208.
    Month Trades Wins Losses Win Rate Net Profit Balance
    Jan 2024 5 0 5 0.0% -$62.50 $237.50
    Feb 2024 5 2 3 40.0% +$31.06 $268.56
    Mar 2024 9 3 6 33.3% +$31.98 $300.54
    Apr 2024 28 10 18 35.7% +$142.18 $442.72
    May 2024 18 5 13 27.8% +$17.64 $460.36
    Jun 2024 10 3 7 30.0% +$19.02 $479.38
    Jul 2024 14 5 9 35.7% +$64.88 $544.26
    Aug 2024 23 3 20 13.0% -$143.48 $400.78
    Sep 2024 13 5 8 38.5% +$79.68 $480.46
    Oct 2024 14 2 12 14.3% -$80.98 $399.48
    Nov 2024 19 9 10 47.4% +$209.74 $609.22
    Dec 2024 18 3 15 16.7% -$80.98 $528.24
    Jan 2025 16 4 12 25.0% -$10.58 $517.66
    Feb 2025 19 5 14 26.3% +$5.14 $522.80
    Mar 2025 15 6 9 40.0% +$102.84 $625.64
    Apr 2025 74 26 48 35.1% +$366.72 $992.36
    May 2025 61 17 44 27.9% +$83.82 $1,076.18
    Jun 2025 23 9 14 39.1% +$131.82 $1,208.00

    What the Backtest Teaches Us About Sideways Markets

    Studying this table reveals fascinating truths about systematic trading:

    1. Losing months are completely normal during chop.
    Out of 18 months, the strategy had 5 losing months (January 2024, August 2024, October 2024, December 2024, and January 2025). Notice what they all have in common: win rates plunged to between 0% and 16.7% due to prolonged sideways consolidation. In August 2024, the strategy took 20 losses and only 3 wins, which is where the maximum streak of 13 consecutive losses occurred.

    2. Trend expansion rapidly obliterates accumulated chop losses.
    Look at April 2024 (+$142.18), November 2024 (+$209.74), and April 2025 (+$366.72). When Gold leaves its consolidation box and makes a sustained directional move, the 1:3 asymmetric payoff triggers multiple Take Profits in rapid succession. A single trending month can cover two to three months of chop drawdown.

    3. You only need a 30% win rate to quadruple an account.
    In standard retail forex marketing, people sell you “90% win rate Holy Grail” systems. The reality of professional trading is far different. With an average loss of -$12.68 and an average win of +$36.70, your breakeven win rate is only 25%. Winning just 30.5% of your trades turned a modest $300 into $1,208 across 384 trades.

    Conclusion: The Operational Cost of Trend Trading

    The conclusion is simple and honest: this strategy will not perform well when the market is sideways. Sideways markets are frustrating, full of false triggers, and guaranteed to deliver multiple consecutive stop losses.

    However, sideways chop is not a flaw in the system; it is the necessary operational cost of catching massive breakout trends. If you risk only 0.01 lot on a small capital base, a 13-loss streak will only set you back -$165, keeping your account safely alive until the inevitable trend expansion arrives.

    Trust the math, respect your risk limits, and let the probabilities work over time.


    Want to discuss or share your thoughts?
    How do you handle sideways market conditions in your own trading? Do you struggle with the psychology of consecutive losses? Feel free to leave a comment below, I would love to hear your perspective!

  • The XAU/USD Round Number Strategy: Trading Gold on M15 with a 1:3 Risk-to-Reward Ratio

    The XAU/USD Round Number Strategy: Trading Gold on M15 with a 1:3 Risk-to-Reward Ratio

    In our introductory guide to round numbers, we explored how psychological price levels act like permanent train stations on major forex pairs such as GBP/USD. Today, we are taking a major step forward: applying this objective framework to the most volatile, trending instrument in the retail market: Gold (XAU/USD).

    Gold is notorious for erratic price spikes and sudden momentum. If you trade Gold subjectively using discretionary trendlines, the market will frequently punish you. However, when you approach Gold with a strictly mechanical, rule-based grid, its high volatility transforms from an enemy into your greatest advantage.

    Here is the exact framework I used to trade XAU/USD systematically on the 15-minute (M15) timeframe.

    The Setup: Pair, Timeframe, and Two Simple Lines

    • Pair: XAU/USD (Gold Spot)
    • Timeframe: M15 (15-Minute Chart)
    • Indicators: None. We only plot two horizontal reference levels: Line X and Line Y.
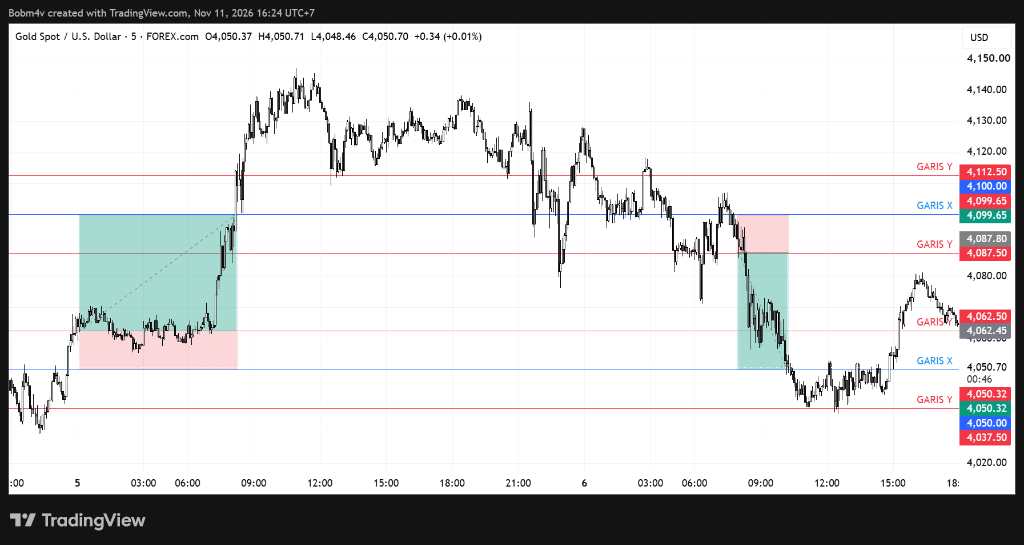
    XAUUSD 5-minute chart showing psychological Line X round numbers and Line Y trigger levels for Gold trading
    XAU/USD M15 Chart: Base Line X (Blue) and Entry Line Y (Red) levels demonstrating 1:3 Risk-to-Reward mechanics. Click to enlarge.

    1. Defining Line X (The Base Station)

    Line X represents our anchor round number: the primary support and resistance level.

    In my strategy, Line X is plotted every 50.00 points (often counted as 5,000 pips depending on your broker’s decimal pricing). Examples include 4,000.00, 4,050.00, 4,100.00, and 4,150.00, extending endlessly above and below current market price.

    Traders often ask: “Why 50 points? Why not 15 or 20 points?” The answer always comes back to empirical backtesting. Through extensive historical testing on XAU/USD M15, a 50-point grid provided sufficient breathing room for Gold’s natural intraday noise while capturing explosive expansion runs. You can certainly test 20 or 30 points, but always verify it through historical data before risking capital.

    Line X serves three distinct purposes:

    1. It acts as the trigger checkpoint to place pending orders.
    2. It serves as our Stop Loss (SL).
    3. It serves as our Take Profit (TP) target.

    2. Defining Line Y (The Entry Trigger)

    Line Y is our actual execution boundary, positioned at a fixed distance from Line X. In this strategy, the distance is set to 12.50 points (1,250 pips).

    For every Line X, we have two Line Y levels:

    • Upper Line Y = Line X + 12.50 (Placement for Buy Stop)
    • Lower Line Y = Line X – 12.50 (Placement for Sell Stop)

    For example, if Line X sits at 4,100.00, Upper Line Y sits at 4,112.50 and Lower Line Y sits at 4,087.50.

    The Execution Rules: Stop Orders Only

    The core philosophy of this strategy is trend continuation, not picking tops and bottoms. We never enter with market orders; we let price action pull us into the market using Pending Stop Orders.

    1. Order Placement: Whenever price touches or crosses Line X (e.g., 4,100.00), we immediately place two pending orders: Buy Stop at Upper Line Y (4,112.50) and Sell Stop at Lower Line Y (4,087.50).
    2. One-Cancels-the-Other (OCO): As soon as one pending order is triggered, delete the opposite pending order. If price surges upward and triggers our Buy Stop at 4,112.50, immediately cancel the Sell Stop at 4,087.50.

    A Concrete Simulation: Walking Through the Numbers

    Let’s walk through an exact, step-by-step price simulation around Line X at 4,100.00:

                     [Next Line X: 4,150.00] ---------> TAKE PROFIT (+37.50 pts)
                                ?
                                ?
                   [Upper Line Y: 4,112.50] ----------> BUY STOP ENTRY
                                ?
                                ? 12.50 pts (SL)
                                ?
        ???????????????????????????????????????????????
                   [Current Line X: 4,100.00] --------> STOP LOSS & RE-TRIGGER LEVEL
        ???????????????????????????????????????????????
                                ? 12.50 pts (SL)
                                ?
                   [Lower Line Y: 4,087.50] ----------> SELL STOP ENTRY
                                ?
                                ?
                     [Next Line X: 4,050.00] ---------> TAKE PROFIT (+37.50 pts)

    Scenario A: The False Breakout (Hit Stop Loss)

    1. Price rallies from 4,100.00 and breaks above 4,112.50, triggering our Buy Stop.
    2. We immediately delete the pending Sell Stop at 4,087.50.
    3. Our Stop Loss is positioned back at Line X (4,100.00), representing a risk of 12.50 points.
    4. Instead of continuing upward, momentum stalls and price retreats back down to 4,100.00.
    5. Our trade is closed at SL for a loss of -12.50 points (or -$12.50 on a 0.01 micro-lot).
    6. The Next Rule: Because price is now sitting back at Line X (4,100.00), we immediately reset and place the two pending orders again: Buy Stop at 4,112.50 and Sell Stop at 4,087.50.

    Scenario B: The Genuine Trend (Hit Take Profit)

    1. Once again, price surges and triggers the Buy Stop at 4,112.50. We cancel the opposite Sell Stop.
    2. This time, buyers dominate. Price storms through intraday resistance and reaches the next Line X station at 4,150.00.
    3. Our Take Profit is hit at 4,150.00, securing a gain of +37.50 points (4,150.00 – 4,112.50).
    4. On a 0.01 micro-lot, that is a clean +$37.50 profit.
    5. The Next Rule: Price has now arrived at a new Line X (4,150.00)! We repeat the process for this new station:
      • Buy Stop at 4,150.00 + 12.50 = 4,162.50 (SL: 4,150.00 | TP: 4,200.00)
      • Sell Stop at 4,150.00 – 12.50 = 4,137.50 (SL: 4,150.00 | TP: 4,100.00)

    This cycle continues mechanically, removing emotional hesitation from every single candle.

    Why a 1:3 Risk-to-Reward Ratio Changes Everything

    At first glance, examining a choppy Gold chart might make you feel uneasy. During consolidation, you will encounter multiple consecutive stop-outs.

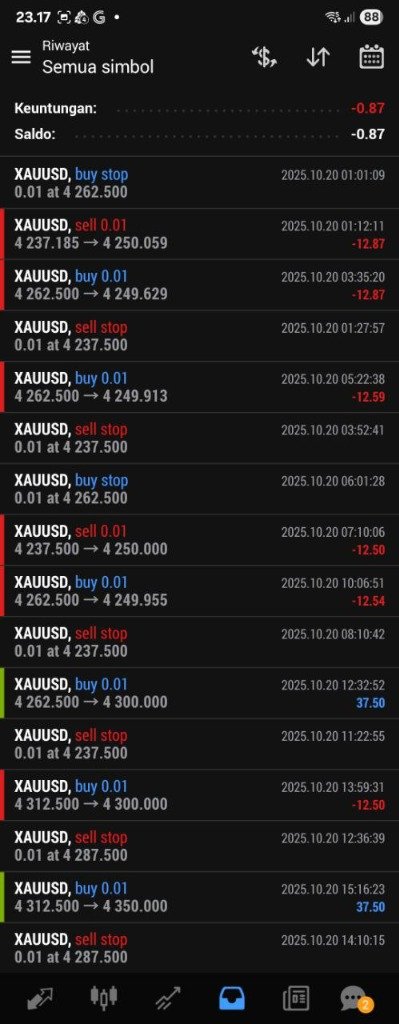
    MetaTrader mobile live execution history showing XAUUSD trades with 1:3 risk reward ratio
    Live MT4 execution log: Small -$12.50 stop losses during market noise quickly recovered by +$37.50 trend completions. Click to enlarge.
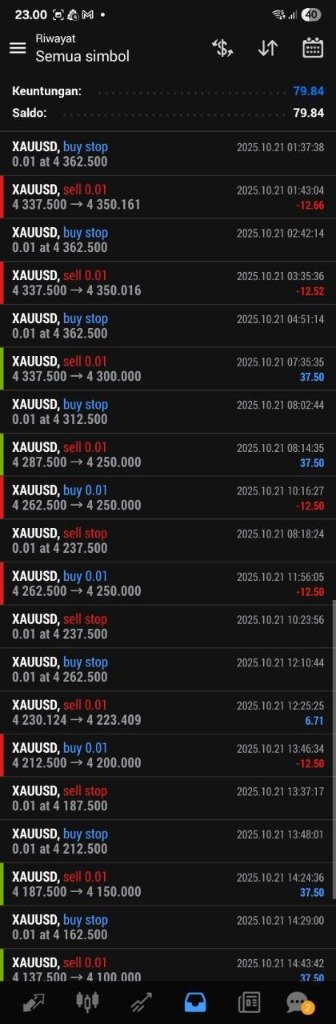
    MetaTrader mobile trading report showing net profit from 1:3 risk reward ratio on Gold
    Account statement showing net positive results: Consistent +$37.50 wins outpacing -$12.50 stops (+79.84 net). Click to enlarge.

    Why am I completely confident running this system despite seeing regular red marks on my terminal? The mathematics of an asymmetric 1:3 Risk-to-Reward ratio.

    • Every Loss: -12.50 points (-$12.50 on 0.01 lot)
    • Every Win: +37.50 points (+$37.50 on 0.01 lot)
    • Ratio: 37.50 / 12.50 = 1:3

    Because our reward is three times our risk, one single winning trade completely erases three consecutive losses. You do not need a 70% or 80% win rate to be profitable. With a 1:3 asymmetric payoff, even a modest 35% win rate yields consistent capital growth over a statistically significant sample size.

    A Note on Lot Size and Systematic Discipline

    In the live execution screenshots above, you will notice I traded micro-lots (0.01). I share this transparently because there is zero reason to hide reality: at the time, this was tested with conservative risk capital.

    In algorithmic and systematic trading, your position size is irrelevant; your mathematical expectancy is everything. Whether you trade 0.01 lots risking $12.50 to make $37.50, or 1.00 lot risking $1,250 to make $3,750, the underlying percentage return and statistical edge remain identical. Always master your system on micro-risk before scaling capital.

    Summary & What’s Next

    Trading Gold does not require predicting the future or interpreting conflicting indicators. By anchoring your trades around predetermined 50-point stations and demanding a 1:3 asymmetric payoff, you let the market do the heavy lifting while keeping risk strictly defined.

    In our next post, we will explore how this mechanical framework can be translated directly into an automated Expert Advisor (MQL4), allowing an algorithm to calculate Line X and Line Y coordinates without missing a beat.

    Do you trade Gold using breakout orders or pullbacks? What intervals have you tested on your charts? Share your thoughts and questions in the comments below!

    ?? Note on Timeframe Selection (M15): Because the Round Number Strategy operates on absolute psychological price levels (Line X and Line Y), the price structure itself does not change regardless of the timeframe. However, executing on the 15-Minute (M15) timeframe provides a critical practical advantage: it filters out random intraday noise and false micro-wicks that frequently occur on M5, ensuring cleaner candlestick reactions and more disciplined order execution.

    Official Automated Expert Advisor . 100% Free

    Automate This Strategy with the Round Number Gold EA

    Why calculate Round Number levels and manage pending orders manually? Download the official MT4 Expert Advisor with embedded 1:3 RR math, automatic pending order purge, and the exact backtested preset (+339% gain on Exness-Real33).

  • Forex Round Number Strategy: The “Train Station” Guide to Objective Trading

    Forex Round Number Strategy: The “Train Station” Guide to Objective Trading

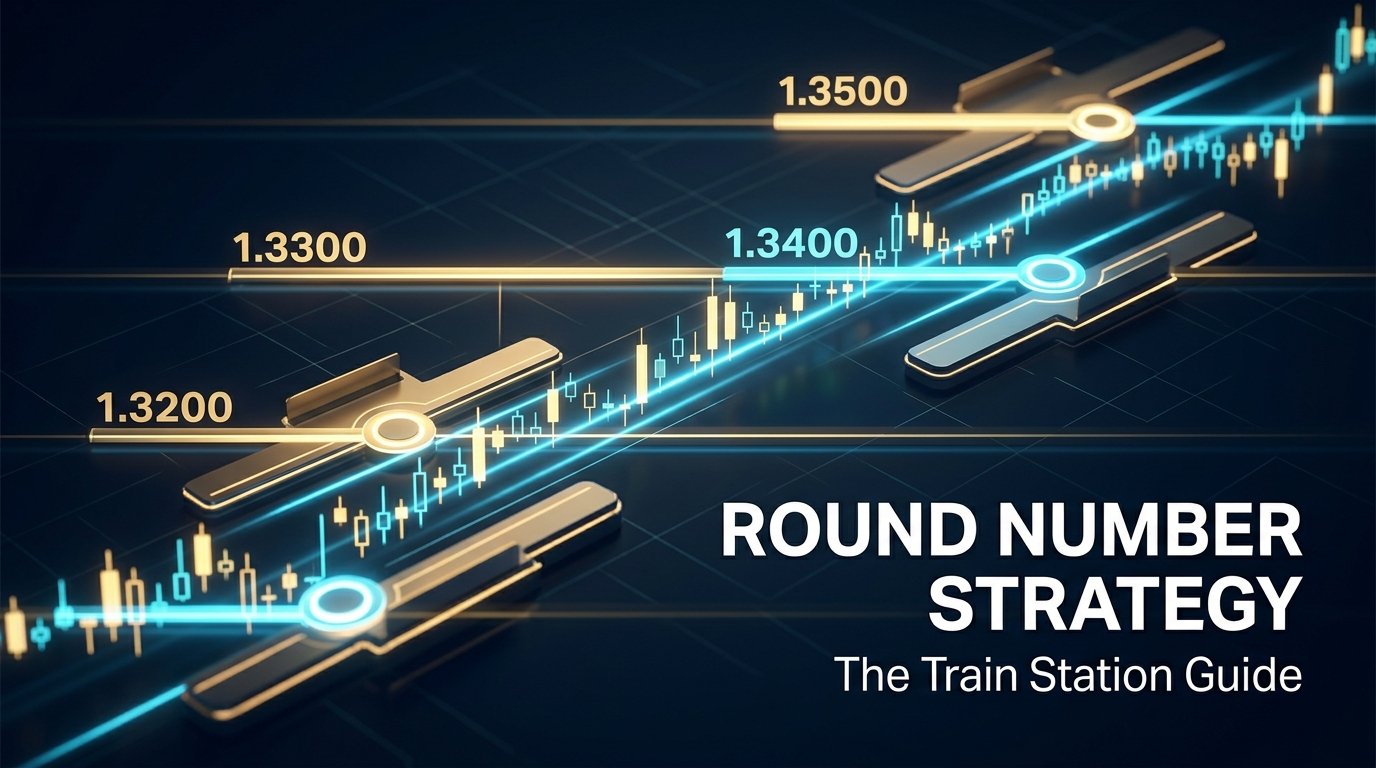
    At its core, the Forex Round Number Strategy is a grounded variation of support and resistance. Traders who practice this approach believe that across currency pairs, specific round numbers act as psychological barriers where price tends to hesitate, stall, or reverse. That is the baseline premise of round numbers.

    Every trader has their preferred numbers depending on the pair. On GBP/USD, for instance, key psychological levels often sit at 1.3200, 1.3300, 1.3400, and 1.3500. When price approaches these milestones, market participants take notice, orders cluster, and you frequently see visible price reactions.

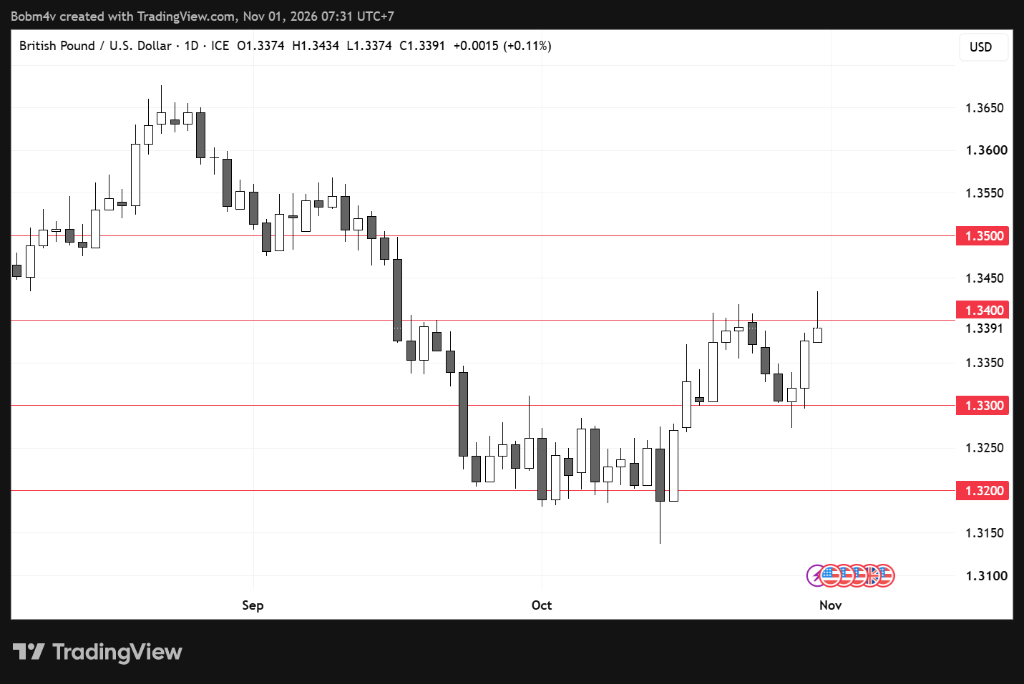
    Take a look at the daily chart below to see these psychological boundaries in action:

    GBPUSD daily chart showing psychological round numbers at 1.3200, 1.3300, 1.3400, and 1.3500
    GBP/USD Daily Chart: Price reacting and trending between psychological round number levels (1.3200 to 1.3500). Click image to enlarge.

    You can clearly see how price respects these horizontal marks. That is the foundational concept of round numbers: identifying round figures that serve as natural psychological pivot points.

    From Counter-Trend Reversals to Trend Following

    While many traders use these levels looking for quick counter-trend reversals, the strategy can be developed in multiple directions. If you want to build a trading model that can be rigorously backtested, the first rule is simple: remove personal subjectivity.

    I personally prefer using round numbers for trend following rather than fighting the market momentum. When a genuine trend unfolds, conventional support and resistance zones tend to break, and price pushes in the direction of the underlying momentum until it reaches exhaustion.

    The Train Analogy: Finding Fixed Stations

    Most trend-following traders rely on pullbacks, waiting for a “discount zone” before joining the trend. A common analogy compares a strong trend to a speeding train: jumping onto a train while it rushes at full speed is dangerous, so you wait for it to slow down at the next station.

    The real issue arises when defining that station. During backtesting, traders often mark stations subjectively, picking arbitrary swing highs, swing lows, Fibonacci ratios, or order blocks. In live conditions, hindsight disappears, and two traders will mark two completely different stations on the exact same chart.

    With a round number strategy, we strip away that guesswork. Round numbers serve as pre-planned train stations where we anticipate price interaction. Regardless of how wild or messy the candlesticks look, the station coordinates are permanent. 1.3300 is 1.3300 yesterday, today, and tomorrow.

    Look back at the GBP/USD chart between September and October. Observe how cleanly price transitioned from 1.3500 down to 1.3200. Instead of second-guessing where to enter, a systematic trader can position predefined pending orders directly around these psychological checkpoints.

    What Comes Next

    This article serves as the opening chapter in our exploration of round numbers. In upcoming posts, we will dive deeper into order execution mechanics, filtering false breakouts, and developing rule-based algorithms to automate this framework.

    What are your thoughts on trading round psychological levels? Do you prefer counter-trend bounces or trend continuation? Drop your thoughts or feedback in the comments section below, and let’s discuss.