Author: admin

  • Objective Trading Strategy: Clear Rules for Success

    Objective Trading Strategy: Clear Rules for Success

    In this article, we will try to create a trading strategy that is objective and unambiguous. Everyone should arrive at the same interpretation of the rules, regardless of their personal opinions.

    Let’s revisit the key requirements of an objective trading strategy:

    1. Clear rules
    2. Clearly defined entry conditions and entry points
    3. Clearly defined exit conditions and exit points

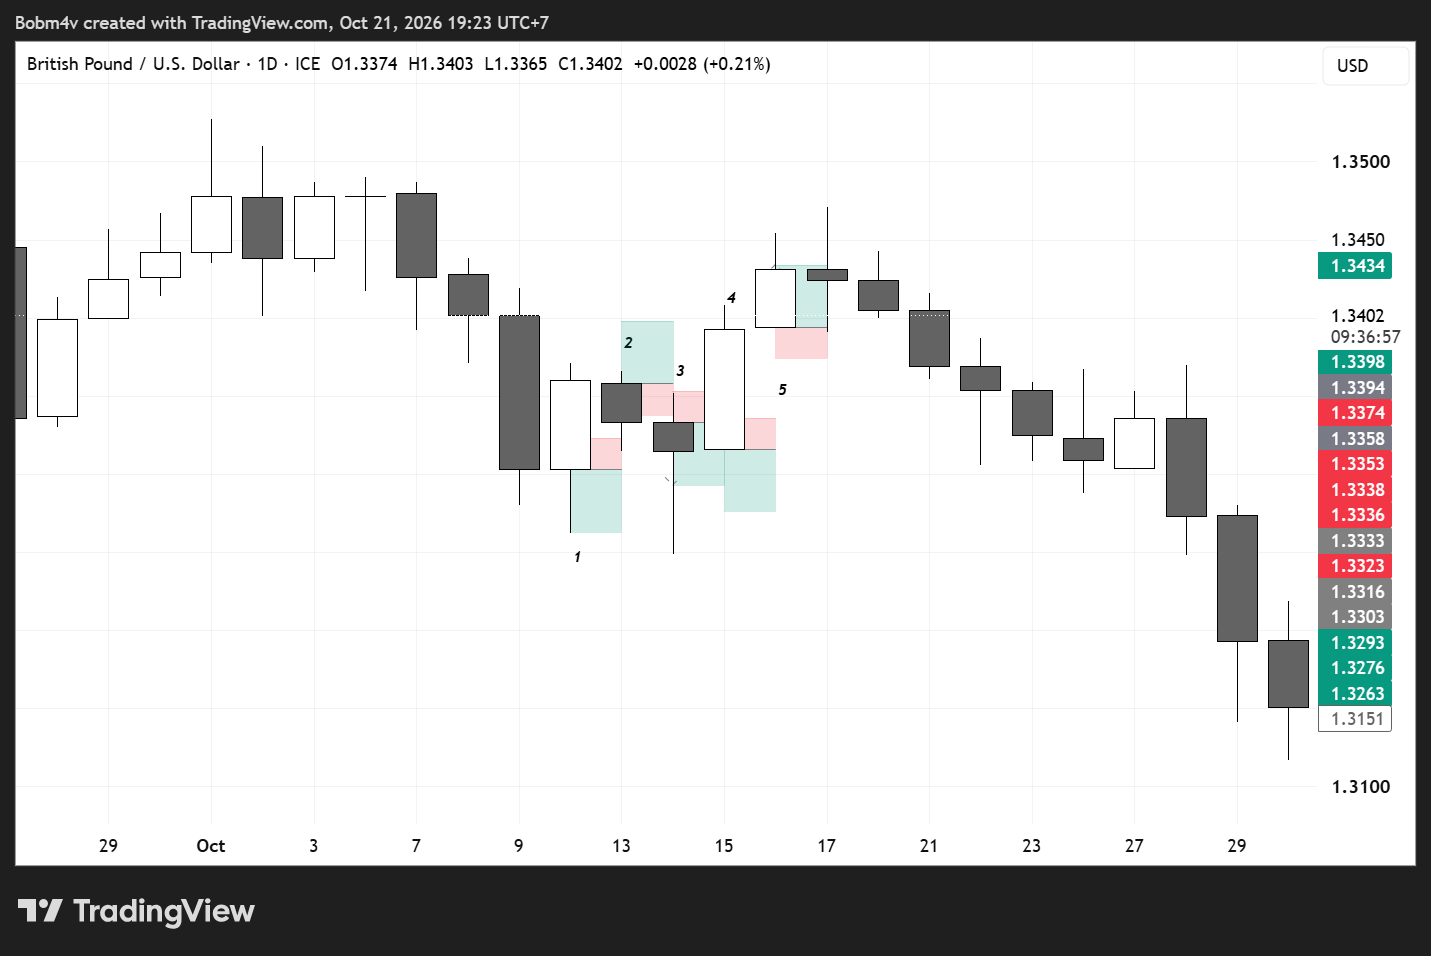
    Now, take a look at the chart below.

    Defining the Trading Rules

    The chart above shows GBP/USD on the D1 timeframe, which means each candle represents one day. I’m sure you already know that, right?

    Let’s define the rules of this strategy.

    1. Trading Rules

    We will only use the D1 timeframe and the GBP/USD pair with a specific broker that we have selected. This is important because candle formations can sometimes differ between brokers.

    2. When and Where to Enter

    I will enter a sell position at the market open today if yesterday’s candle closed bearish. I will enter a buy position at the market open today if yesterday’s candle closed bullish.

    Even if a candle is only slightly bullish or bearish, as long as it can be identified as bullish or bearish, we will use that signal.

    3. When and Where to Exit

    I will only exit a buy or sell position when either the Take Profit (TP) or Stop Loss (SL) is hit.

    Never change this rule during the test, because doing so could affect the backtesting results. In this example, the SL is 20 pips and the TP is 40 pips. These values can be adjusted when testing different variations of the strategy.

    Let’s Review the Results

    Now, let’s discuss the results based on the numbered candles in the image.

    1. Candle 1: In my view, the TP was hit first before the price moved up, giving us +40 pips.
    2. Candle 2: The SL was hit, resulting in -20 pips.
    3. Candle 3: The TP was hit, resulting in +40 pips.
    4. Candle 4: The SL was hit, resulting in -20 pips.
    5. Candle 5: The TP was hit, resulting in +40 pips.

    So far, we have hit TP three times and SL twice.

    The total result is:

    • Total profit: 3 × 40 pips = 120 pips
    • Total loss: 2 × 20 pips = 40 pips
    • Net result: +80 pips, before transaction costs.

    Do you understand how this strategy works, everyone?

    One Important Thing to Consider

    There is one important detail we need to consider when evaluating a strategy using the D1 timeframe.

    Each daily candle shows the opening, highest, lowest, and closing prices for that day. However, it does not show the exact sequence in which prices moved between those points.

    What if the price hits both the TP and SL levels within the same daily candle?

    Using D1 data alone, we may not be able to determine which level was reached first. If we simply assume that the TP was hit first, we could overestimate the strategy’s performance. The opposite assumption could underestimate it.

    To handle this situation more reliably, we can use lower-timeframe data to investigate the price movement in greater detail. Alternatively, we can establish a consistent testing assumption for every ambiguous trade and clearly document that assumption.

    The important thing is to apply the same method throughout the backtest. We should not choose whichever outcome produces the most favorable result.

    Your Turn to Try It

    Creating an objective trading strategy can be this simple.

    Your task now is to try it yourself using any currency pair you like. Keep the rules consistent and record the results.

    Is this strategy profitable?

    To find out, we need to conduct a backtest.

    What is backtesting, and how do we do it? We’ll continue in the next article!

    If you have any questions or comments, feel free to share them. I’m happy to discuss them with you.

    Risk Disclaimer: This article is intended for educational purposes only. Forex trading involves the risk of financial loss, and historical testing results do not guarantee future performance.

  • Dissecting a Forex Strategy: What Makes It Worth Using?

    Dissecting a Forex Strategy: What Makes It Worth Using?

    In the world of forex trading, we can find many strategies that offer different approaches to analyzing price movements. Some strategies use technical indicators, candlestick patterns, breakouts, pullbacks, or a combination of several analytical methods.

    Whatever strategy you want to use, there is one thing you must ensure: THE STRATEGY MUST BE OBJECTIVE.

    What do I mean by objective? Let me give you an example. When I identify a candle as a bullish candle, other people should also identify it as a bullish candle. There should be no difference in interpretation.

    At this point, you should have a clear understanding of what I mean by an objective strategy.

    Why should subjective strategies be avoided? Let me explain this more clearly with the image below.

    But first, let me ask you a question: Have you ever learned a forex trading strategy where the instructor said, “Look, the current trend is bearish,” while you thought it was bullish?

    Look at the GBP/USD chart above on the D1 (daily) timeframe. If you are asked, “What is the current trend?”, the answer may depend on how each person interprets the price movement.

    Traders who interpret the market as bearish may draw a red trendline, while those who interpret it as bullish may draw a blue trendline.

    This illustrates the subjectivity of trend analysis: different traders can look at the same chart and reach different conclusions. Without clear and consistent rules for identifying a trend, the analysis can depend heavily on individual interpretation.

    Now, let’s take a look at what happens next on the same GBP/USD chart.

    A few days pass, and new candles begin to form. Surprisingly, the price moves downward again. This raises an important question: Was the trend actually bullish, or did we simply interpret the chart differently?

    But that’s not the only problem. Even if we agree that the market is trending in a particular direction, we may still disagree on which swing highs and swing lows should be used to draw the trendline.

    Before long, the chart can become cluttered with multiple trendlines, each telling a different story. Instead of helping us make decisions, our analysis leaves us wondering: Which trendline should we trust?

    This is exactly why objectivity matters. A trading strategy should provide clear, consistent rules so that different people analyzing the same chart can reach the same conclusion.

    If you are already experienced with this type of strategy, you may disagree with my perspective. That is perfectly fine. My intention is not to claim that trendline-based strategies cannot work, but to highlight a fundamental challenge: how can we know whether a strategy is truly effective if its rules depend heavily on individual interpretation?

    In my view, this subjectivity creates several problems.

    • No consistent rules: It becomes difficult to define precise, standardized conditions for identifying a trend.
    • Ambiguous swing points: Different traders may choose different swing highs and swing lows when drawing trendlines on the same chart.
    • Inconsistent entry and exit rules: If the trendline itself depends on personal judgment, the resulting entry and exit points may also vary from one trader to another.
    • Difficult to conduct objective backtesting: Without clearly defined rules, it becomes challenging to test a strategy consistently against historical data. The results may depend more on how the chart is interpreted than on the strategy itself.

    For me, this is the core issue. A strategy should not rely on what a trader thinks they see on a chart; it should rely on rules that can be clearly defined, consistently applied, and objectively tested.

    By now, I hope you have a clear understanding of what I mean when I say that a trading strategy should be objective rather than subjective.

    Are there other subjective trading strategies? Absolutely. In fact, some of them are very popular, such as Order Block strategies. In my view, these strategies can be particularly challenging to backtest objectively because identifying valid order blocks may depend on individual interpretation.

    That’s all for this discussion. See you in the next article!